Cómo Leer un Espectrograma Schumann: Guía de Campo Completa
Aprende a interpretar los espectrogramas diarios de Tomsk SOS como un analista real del clima espacial.
Understanding the Spectrogram
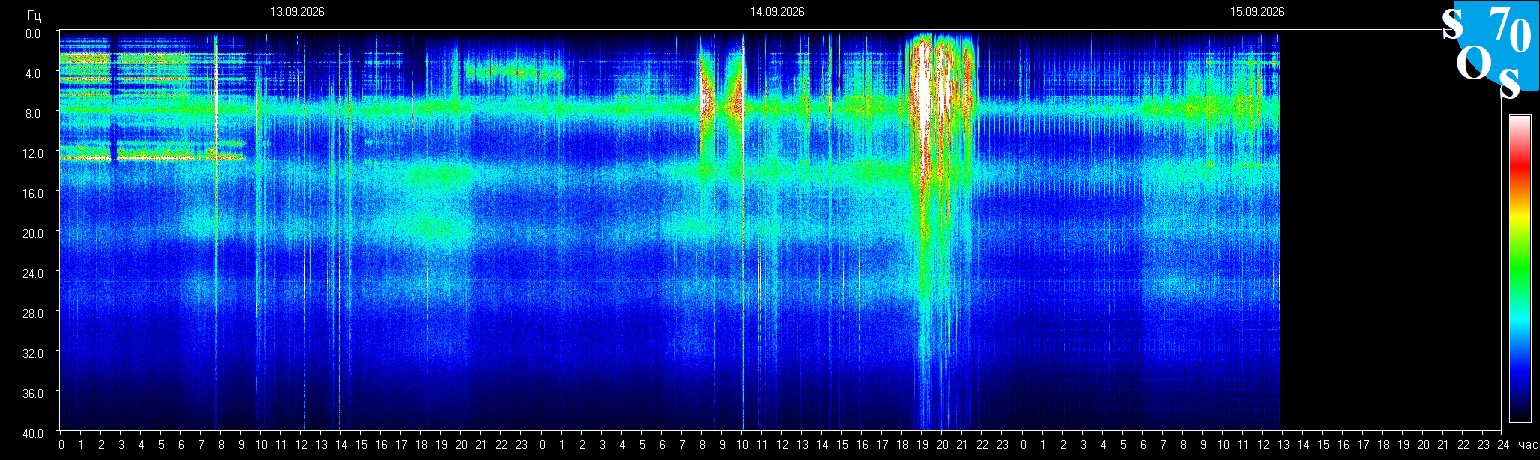
The spectrogram from the Tomsk Space Observing System is a 24-hour visual record of Earth's electromagnetic activity. The X-axis shows time (00:00–23:59 UTC), the Y-axis shows frequency (0–40 Hz).
Reading the Colors
Color intensity represents amplitude:
- Dark blue/black — low activity
- Yellow/orange — moderate activity
- White/gold — high-energy events
Identifying Harmonics
Look for horizontal lines at the fundamental and harmonic bands:
- SR1 — 7.83 Hz (fundamental mode)
- SR2 — 14.3 Hz (first harmonic)
- SR3 — 20.8 Hz (second harmonic)
Detecting Events
Vertical bright lines indicate sudden energy events caused by thunderstorms or geomagnetic disturbances. Learning to read these patterns allows you to track global electromagnetic activity in real-time.
Practical Tips
The Tomsk SOS website updates this spectrogram every 24 hours, providing an invaluable resource for monitoring Earth's resonant frequencies. Check it daily to observe trends and correlate with solar wind data.